New Report
See the Floor Like Never Before
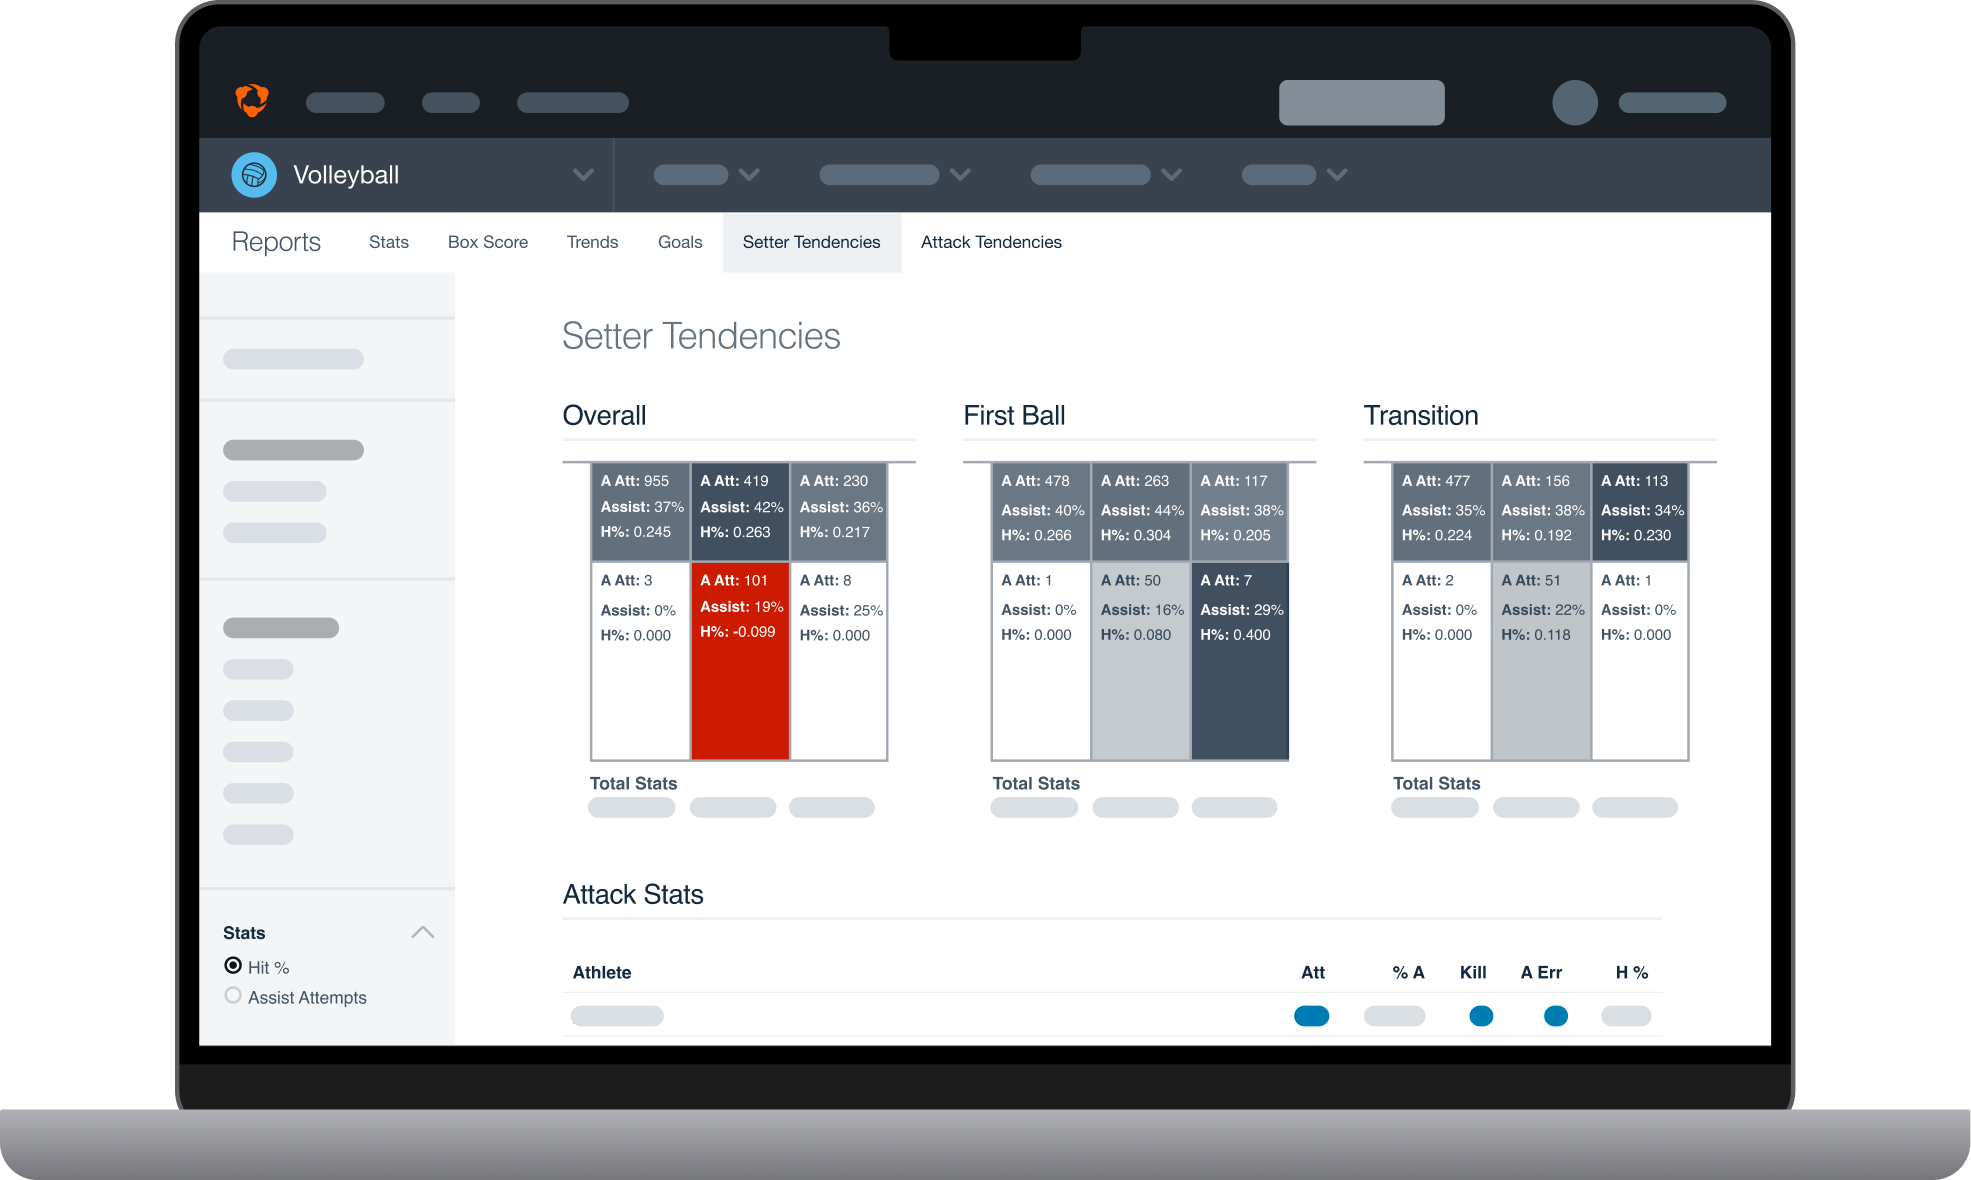
Unlock an all-new advantage for volleyball with Setter Tendencies and see how your setter and your opponents’ attack the floor.
Study the
grid.
Zone-by-zone breakdown of set volume, efficiency and outcomes for teams, players, or rotations.
Analyze set
distribution.
Quickly see the set frequency to key parts of the floor.
Optimize your
attack.
Winning points is the name of the game. Uncover offensive efficiency in zones with sets leading to kills.
Check all the boxes.
This visual report divides the floor into six key zones: front to back, and left, middle or right. See where your setters tend to set and the result of each attempt.

Find the sweet spots.
The darker the square, the higher the frequency or efficiency. Every zone and stat is linked to video–quickly share clips with your team to analyze setter distribution and indicators of success.

| Total Stats | |||||
|---|---|---|---|---|---|
| Assist Attempts: | 2441 | Assist: | 30% | Hitting %: | 0.093 |
Filter your view.
Choose how you view the report with filters to pinpoint tendencies and uncover insights in seconds.
See Filters in Action
Want to see more?
Tell us about your organization and a representative will contact you to talk about Hudl.