How to Use Last Year’s Data to Craft Your Preseason Plan

Examine your team’s stats from last season to discover clues into how you should prepare for this year.
Basketball season is in sight, and it’s time to start creating strategies for the upcoming year. You have a system in place, but your team underwent changes in the offseason. Seniors departed, players may have transferred in and out and last year’s supporting players had an entire summer to develop their games for a larger role.
Juggling all these factors can make planning this year’s strategy a difficult task. Let the data help.
Stats don’t solve every problem, but they can go a long way toward helping you spot strong points or inefficiencies within the team. Link those numbers to video and you have a very powerful preparation tool at your disposal. Here are some things to consider as you sift through the stats to craft your 2017-18 plan.
Account for What's Headed Out
Replacing departed players is the most onerous part of any offseason. After spending years of growing, developing and getting to know these kids, you’re forced to replace them. And by nature, seniors generally account for a good portion of a team’s production. Filling their minutes, scoring and defense isn’t easy.
But before you start to build a plan for their replacements, you need to see what you’ve lost. Take a deep dive into your seniors’ stats to discover what gaps need to be covered.
If you lost your top 3-point shooters, consider extra practice time on shooting to develop some new snipers. If your center and anchor of your 2-3 defense headed out, maybe you’ll have to adapt your scheme this season.


Plus-Minus
This stat accounts for how the score fluctuated when a particular player or lineup was on the floor. A positive plus-minus means your team outscored the opposition. The higher the number, the more effective your team functioned with a certain athlete on the court.
While this is more useful for lineups than individuals, it can help you find winning players who perform important roles outside of scoring. It can also expose players who appear very valuable because of their offense, when in reality their scoring is empty and inefficient.
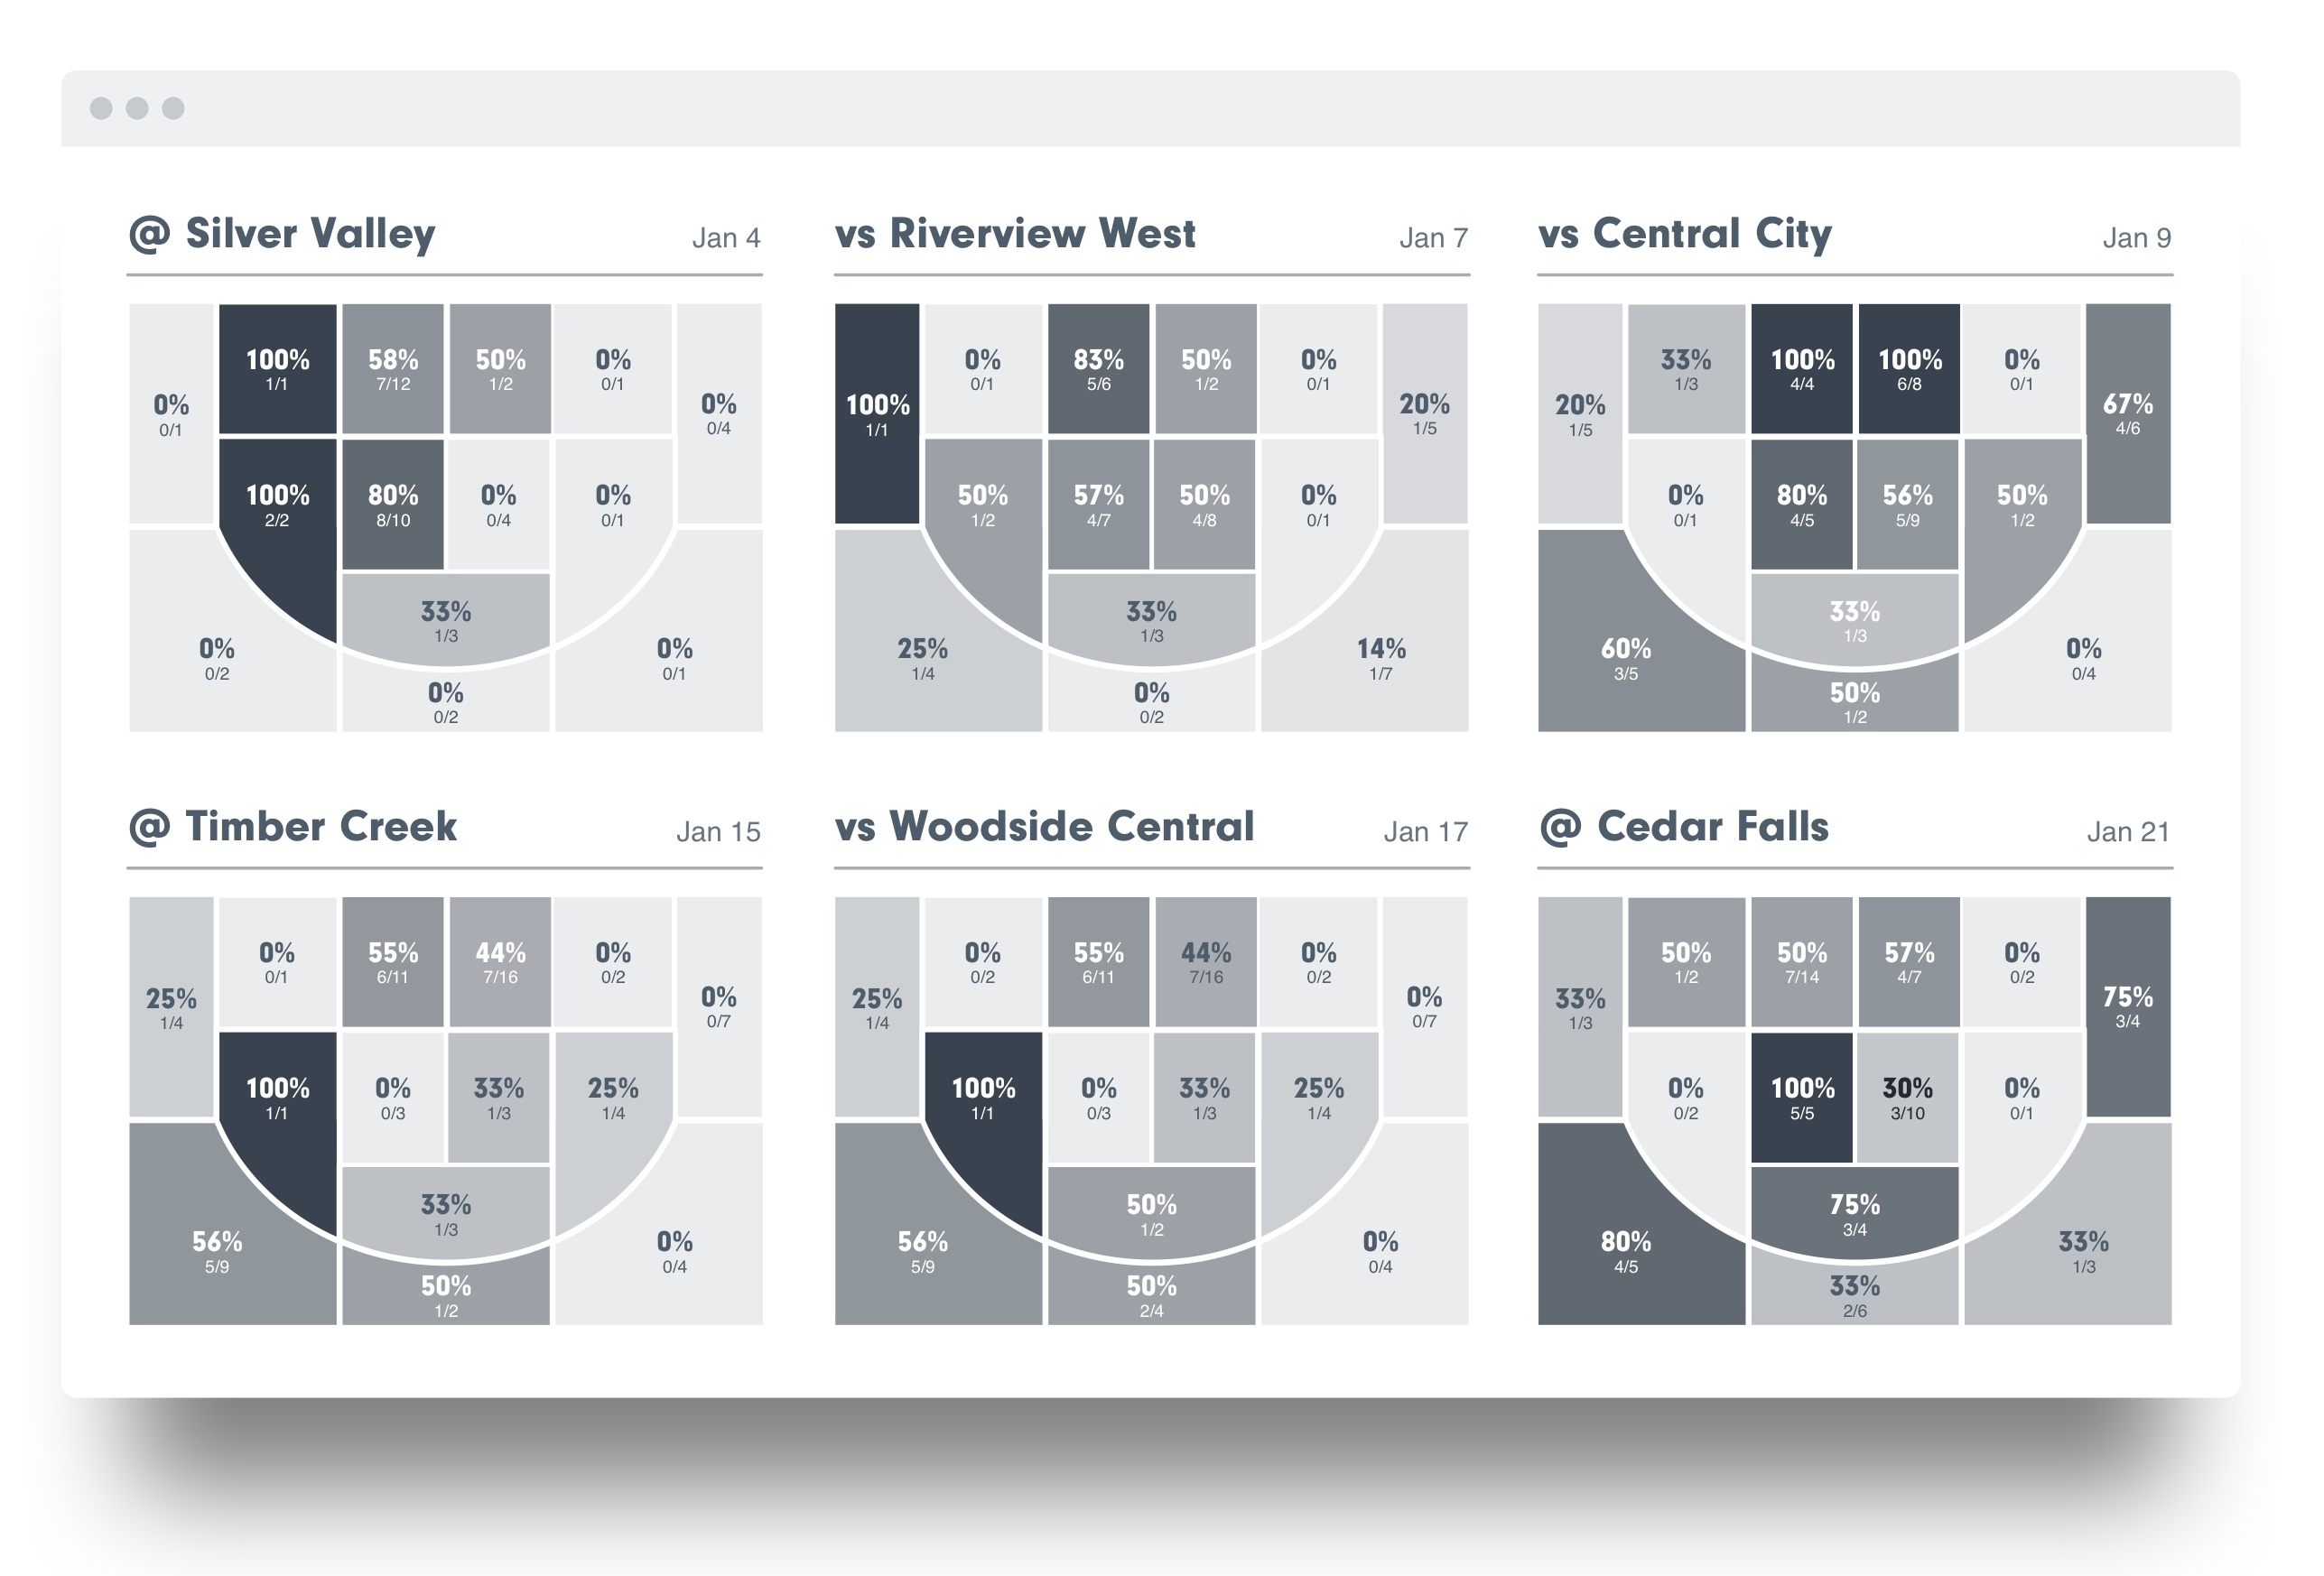
Shot Charts
A shot chart in itself is a powerful tool because it shows how well a player shoots from each part of the court. But when linked to video, it displays how and why that player got those shots, taking things to a higher level.

