How This High School Uses Hudl Assist to Run ‘like a Small College’

In just a few short years, this small-town Kentucky program has gone from hunter to hunted. How? With the details from in-depth data reports.
Possession as a defensive weapon
Pagel knew early in the season that the team was struggling. One reason why was a defense that often simply blasted the ball up the field. This resulted in an average time of possession somewhere in the 19 to 22-minute range over an 80-minute game. Every team has their own unique “sweet spot” for optimal time of possession. For Pagel, and head coach Mike Boone, the target is in the 29 to 35-minute range.
After he paired this data with the volume of shots the Marshals were allowing, which broke down to once every two minutes or so, Pagel issued a challenge in the form of an equation—how can they keep the ball for six more minutes a game, and therefore cut down on three shots from the opposition?
“We try to use the math, and it’s easy to sell that way,” Pagel says. “We can say, look at their time of possession and look at ours, that’s why we need to make this extra pass to the right back, versus dumping the ball into our forward.”
Pagel likes to be possession-oriented as opposed to a defend-and-counter style. He was raised classically on the tried-and-true 4, 4, 2 formation, with a stopper and sweeper, “but that’s a dinosaur now.” The Marshals play a 4, 2, 3, 1 with an offset triangle in the middle, and Pagel is devoted to the formation, both for its ability to overwhelm opponents with numbers everywhere, and for the way it allows for quick counters.
Hard possession goals allowed Pagel to set the bar high early in the season, when they overwhelmed inferior opponents. Only 23 minutes in that easy win? Not good enough. He encouraged them to make that one last wide pass that gives them the 2-on-1 or 3-on-2 advantage up the other side of the pitch. Time to work on taking that pass from the left midfielder and linking up in the middle, instead of looking through to a forward.
“We can talk through all that, and then show them it,” Pagel said.
We try to use the math, and it’s easy to sell that way. We can say, look at their time of possession and look at ours, that’s why we need to make this extra pass to the right back, versus dumping the ball into our forward.
Less is more in transition
Attack transitions are one area of the game where more isn’t necessarily better. In one game, Marshall County had 101 attack transitions—way too high and indicative of a poor job keeping the ball. If you’re playing against better competition, and playing with more balance, you’ll likely have anywhere from 60 to 80 such transitions.
Pagel pointed to a recent game against Murray High where the Marshals dominated, but their performance left Pagel questioning how well they executed. Sure enough, when he looked at the pass strings on the reports, he found the goalkeeper responsible for a number of unsuccessful passes.
Of course this goalie, a returning captain and the school’s all-time leader in shutouts, was no slouch. But all those acrobatic dives, stops and catches are only part of what a goalkeeper’s game should be. They have to be able to keep possession, too, especially in today’s game where the keeper can often act as a sweeper. His goalie wasn’t allowing enough time for openings in the field to develop before trying to find a pass.
With these points tied to video, Marshall County’s goalkeeper coach knew how to design better practices to shore things up.
“Shutouts are good, but I also want to see how we can turn it into something better,” Pagel said.
If I say focus at this time, they know what I’m talking about. I’ll yell out ‘Hey, let’s focus for these next 10 minutes’, and they give a thumbs up. They know what it means. They know there’s that lull in the game that tends to happen.
A safer approach with pass strings
With a 62 percent success rate on passes in the defensive third, well below his goal of 70-75 percent, Pagel understood his team needed to be more cautious with the ball in their own end—but also that it wasn’t all entirely on the back line. The goalkeeper and midfielders bear some responsibility too. Seeing these percentages allowed them to have more informed conversations about safety, versus risk with decision-making.
Just as higher possession numbers don’t always indicate more purposeful attacking, volume of shots doesn’t always mean better offense. The Marshals averaged 5.1 passes per string this season. Pagel said he’s “not always proud” when they average more than six passes, because they could just be kicking the ball laterally or backwards a lot, but it’s a great stat to keep an eye on.
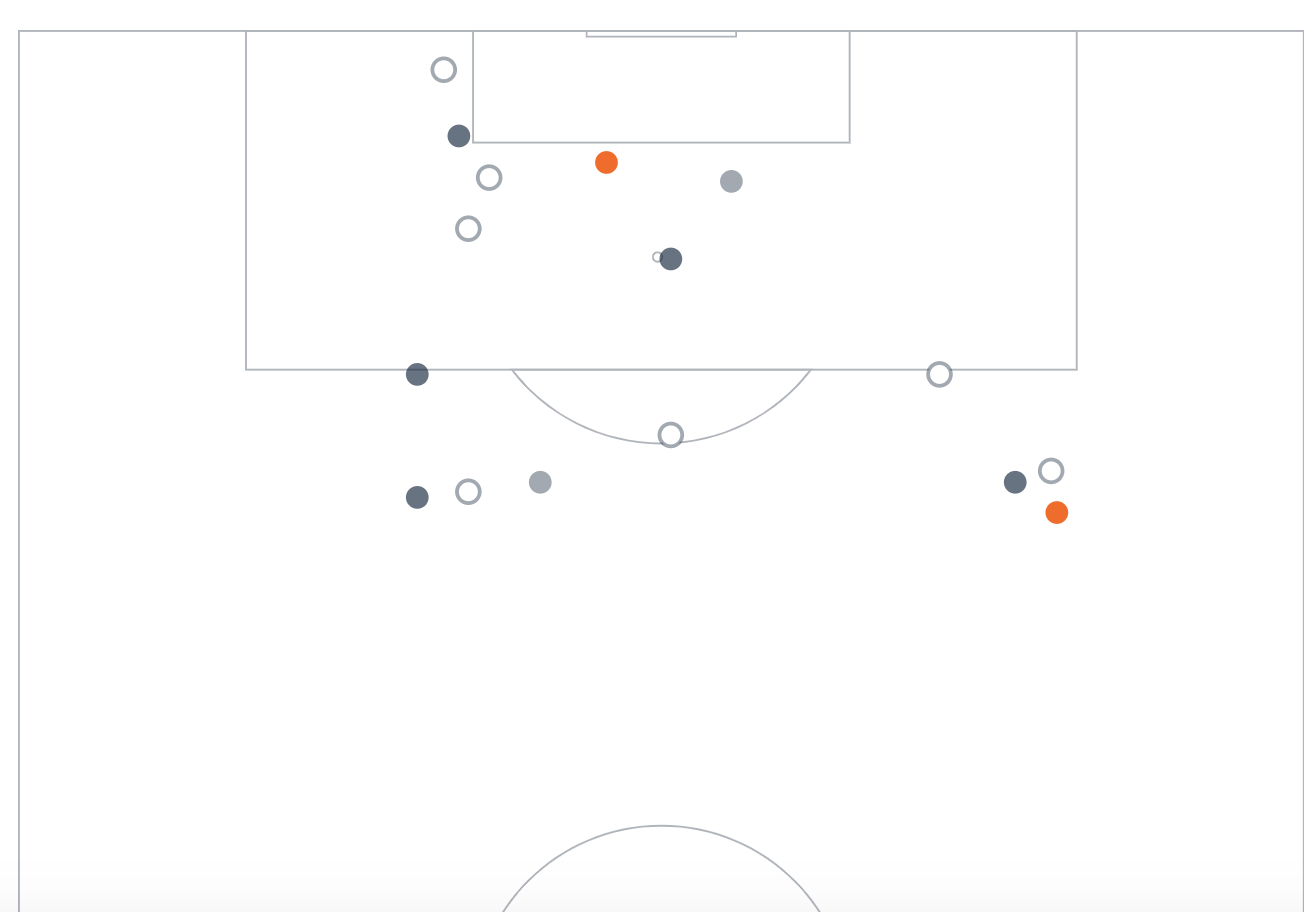
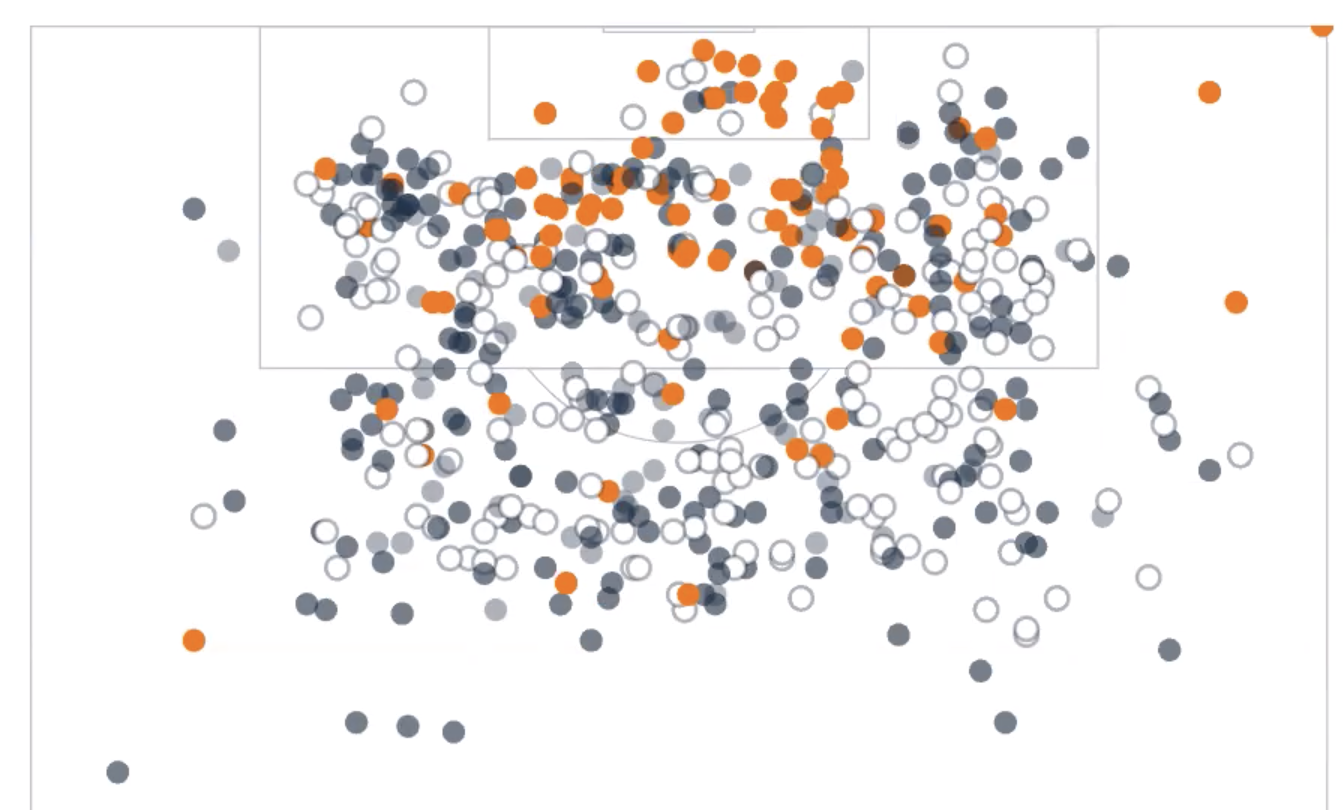
“A good team like the No. 1 team in the state might get 12 shots, but three of them are goals, because of the nature of how they penetrated, and they walked it in,” Pagel said. “We got fewer shots but more goals because our shot quality selection was better. It’s not unlike basketball—yeah, you’re jacking up a lot of three’s, but is that a good idea?”
Charting successful and unsuccessful strings also allowed them to be constructive with their coaching, praising great plays while also wondering how the success in one area can be applied elsewhere.
“You don’t have to just say, ‘Why was this wrong?’ You can look at the successful ones and say, ‘Attagirl, here’s what you did right’, and ask, ‘Could we have done this on the one we messed up with?’” Pagel said.

