Find the Right Connections Through Lineup Data
Some players just play better together. Lineup data will help you pinpoint the right combinations.
Few sports require chemistry as much as basketball. Miscommunication can result in defensive lapses or turnovers, while some teammates are so in tune with one another they appear to have precognition. For whatever reason, certain groups of players perform better with one another, and your five most talented athletes may not be your most lethal combination.
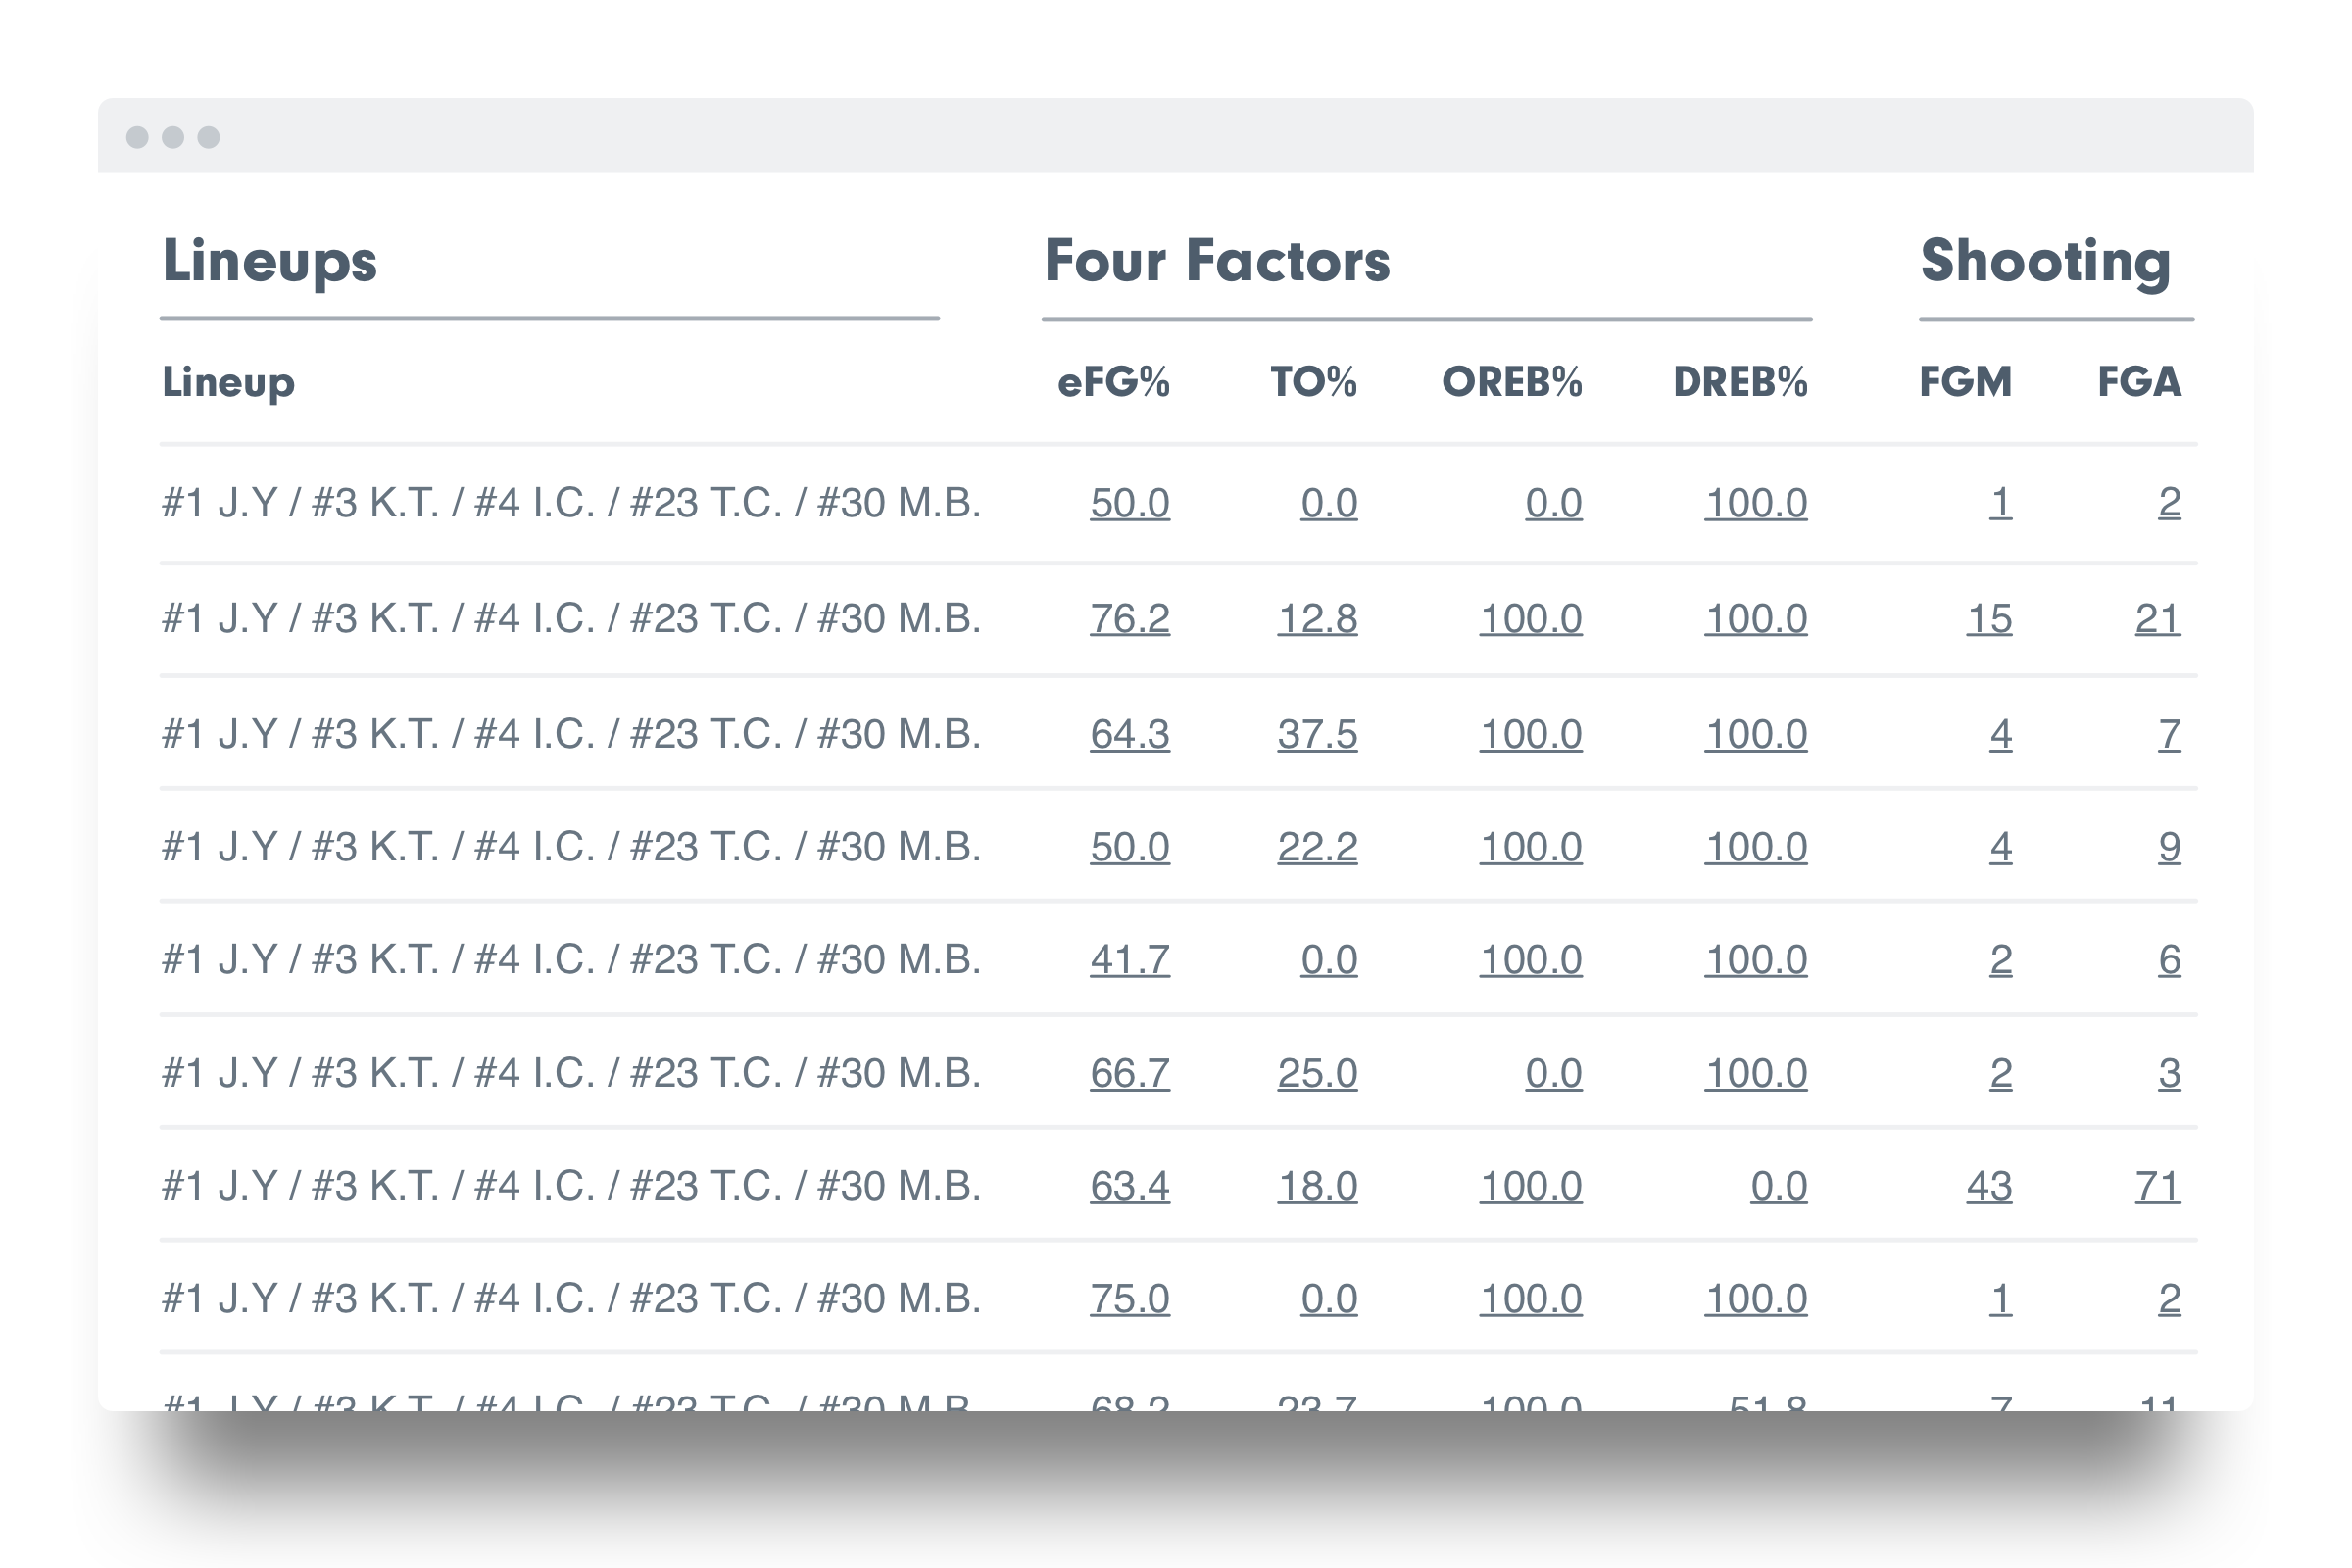
This is why lineup data is such an important statistic. Sometimes chemistry is easy to spot from the sidelines, but it’s always useful to have the data to back up your hypothesis. With lineup data, you have that power.
“What I see in the data sometimes points out errors in the ways that I think,” Rob Brost, head coach at Bollingbrook High (Ill.), said. “That is my first red flag, like ‘Maybe I’ve got the wrong lineup out here.’ You can look and say, ‘We had lineup A out there in crunch time and it wasn’t very effective. But in the next game, we had a different group out there and that group was much more effective.’”

You can sort through different stats to find your most effective combinations and how they fit your current need. The Value Point System gives you an overall view of your most efficient lineups, but other stats prepare you for specific situations.
“I rotate in a lot and I like that it shows me a pattern,” Chris Horton, the women’s coach at Lone Oak High (Texas), said. “If I’m in a situation where I need steals, I can know what group is best for that. If I need us to protect the ball and shoot free throws, I can see which group is best for that. Since we rotate so much, it lets me know — depending on what situation I need — what grouping I can put in.”
NBA teams lean heavily on lineup data, and colleges have begun exploring the difference in combinations. Tucker Zeleny began working with the Nebraska basketball team last season as the school’s Director of Sports Analytics and Data, and he could see small shifts in coach Tim Miles’ rotations based off the lineup stats.
“We’d see something that would pop up and we’d send it along, then you’d see some changes in the games,” he said. “I don’t want to assume that was all driven by what we’re coming up with, but there were some changes from time to time that made us wonder if they were basing off what we found here.”
It can also be helpful to look at the lineup numbers for upcoming opponents. A coach may have an objective in mind when he goes with a certain grouping, and by looking through the numbers you can identify his thoughts.
By sifting through the opposition’s most effective lineups, you can see what makes those lineups click and devise plans to counter. For example, another team may deploy a smaller lineup that ratchets up the ball pressure and forces a lot of turnovers. A corresponding move might be to insert your steadiest ball handlers and a few bigger players who can crash the offensive boards.
As with any stat, however, lineup data doesn’t tell the whole story. It can help uncover some combinations that should be playing together more often, but to fully utilize the information, you have to combine it with what you see and know as a coach.
“You have to be open to information that you’re getting,” Brost said. “Sometimes what you think in your head is not accurate, but you go with it anyway because you have a feeling that might work on a given night. You really need to combine the information that you get and the feel that you have, and some of that comes with experience.
“Hudl has been really instrumental in taking our program to the next level. It’s not a coincidence that in each of the last four years we’ve won 20+ games. All of that has come when we started to implement and use the data from Hudl Assist to better evaluate where we’re at.”