Breaking Down a Defense with Hudl IQ
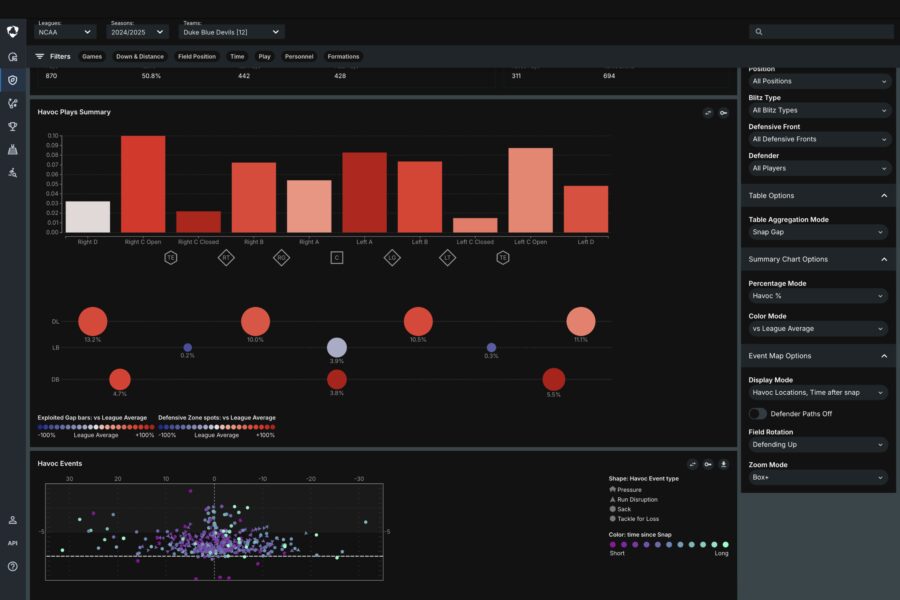
Hudl IQ tools help coaches quickly analyze defensive schemes, spot tendencies, and find weaknesses to create smarter, more effective game plans.
Every week in offices across the country, football coaches watch hours of film. The gist of hours and hours of film watching gets boiled down to those three buckets. Without getting into the nitty gritty of what film study looks like for these coaches; each staff or coach has different things they are looking for, but the ideas are consistent across the board.
- What is the overall scheme of your opponent?
- What are things they do especially well?
- What areas do they struggle in, or are particularly vulnerable?
I have always felt like there is a pretty big difference between offensive and defensive coaches with film study and game planning. To me, defensive coaches are like scientists, critically analyzing opposing offensive tendencies. If you look at their opponent breakdown binders, they are chuck full of tables for every situation imaginable. Defenses by nature have to be very reactionary. If the offense does A (A being some mixture of down & distance, personnel, formation, motion, etc) then we will do B (B being some mixture of personnel, front, stunt, blitz, coverage). If A then B, if C then D, etc.
Offensive coaches on the other hand are more like artists. They are in control of the flow of the game: tempo, personnel, formation, motion, play calls, and more. Especially creative or successful play callers are often called mad scientists, but that description feels off to me. Offensive play callers are more akin to particularly successful artists, creating successful game plans from a blank canvas.
One of the best feelings as a coach, offense or defense, is finding a tendency or weakness in your opponent, putting together a play or gameplan specifically to exploit it, and then having that be successful on gameday. Sometimes that tendency can be found in the hours of film study, or that process can be aided by analytics to help coaches notice things earlier. We have recently released two tools that will help offensive coaches break down opposing defenses to a higher degree at speed. Helping them find those tendencies, or glaring weaknesses to exploit on gameday!
Assessing Defensive Schemes with Hudl IQ
As mentioned above, the first step in breaking down an opponent is finding out the overall scheme of an opponent. Our new defensive scheme page does just that! Below you will find a screenshot from our defensive scheme tool for Notre Dame. The Fighting Irish have been one of the best defenses the past two seasons. They are currently 1st in passing EPA/play against, 1st in CPOE defense, 2nd in EPA/play, 3rd in explosive plays against, 4th in yds/play, I could go on and on.

The defensive scheme page is meant to give the user a full breakdown of what a defense does on the field. The initial view breaks down front into two larger categories: odd and even, with column labeled unknown for everything else. Blitzes are broken down into three categories: blitz, simulated pressure, or no blitz. A simulated pressure is bring 4 rushers, while dropping at least 1 defensive lineman into coverage responsibilities. The last section covers coverage; the initial split being man and zone. For each of these categories, users are given summary statistics including total plays, EPA per play, yards per play, success %, and more.
In 10 seconds I can look and say Notre Dame is a primarily 4 down front team, that blitzes a lot (with a lot of success while blitzing), and plays primarily man coverage. Bam, step 1 done! Not really, but here is the broad brush overview of what type of defense Notre Dame plays.
Each of these categories can be expanded to show more detail. For example, the front section expands to show us they are about the same playing Under and Over fronts, and when they do play an odd front it is primarily a Tite front. They don’t play out of an Okie front very much, but have a TON of success when they do, so I know I will want to dive in there for further analysis. Although they play similar total snaps in Under and Over, their EPA per play is much better out of Over. It looks like the EPA per pass is a large culprit in why that is the case. I would want to dive deeper into the pass game when Notre Dame is in an Over front. Why are they more successful in that front? Is it better blitzes? Better people in coverage? As you can see, once you get the first question answered, it easily bleeds into directing the next two steps.

Blitzes are next up. As mentioned above, Notre Dame blitzes a lot! In fact, they blitz third most in college football. With that info, I need to know what to expect when Notre Dame blitzes. Opening up the details in the blitz section I see that Notre Dame primarily blitzes up the middle. 57% of their blitzes are middle based, while another 16% have some blitzer in the middle. Adding in our global filters, shows that Notre Dame actually increases the pressure on 3rd downs. Their blitz rate jumps from 42% to 52%.

Notre Dame primarily plays man coverage, but what type of man? Cover 0, Cover 1, Cover 2 man? I open up the coverage section details to find out more, and it looks like 89% of their man coverage plays are cover 1. Over half of their zone coverages are cover 3, so we can expect a lot of middle of the field closed coverages. Whenever a team plays a lot of zone, one of the first areas to study is if there are defensive backs who are particularly effective in man coverage, or potential weak spots to target. As a side note, I would try to avoid being forced to throw if at all possible against their DB’s.

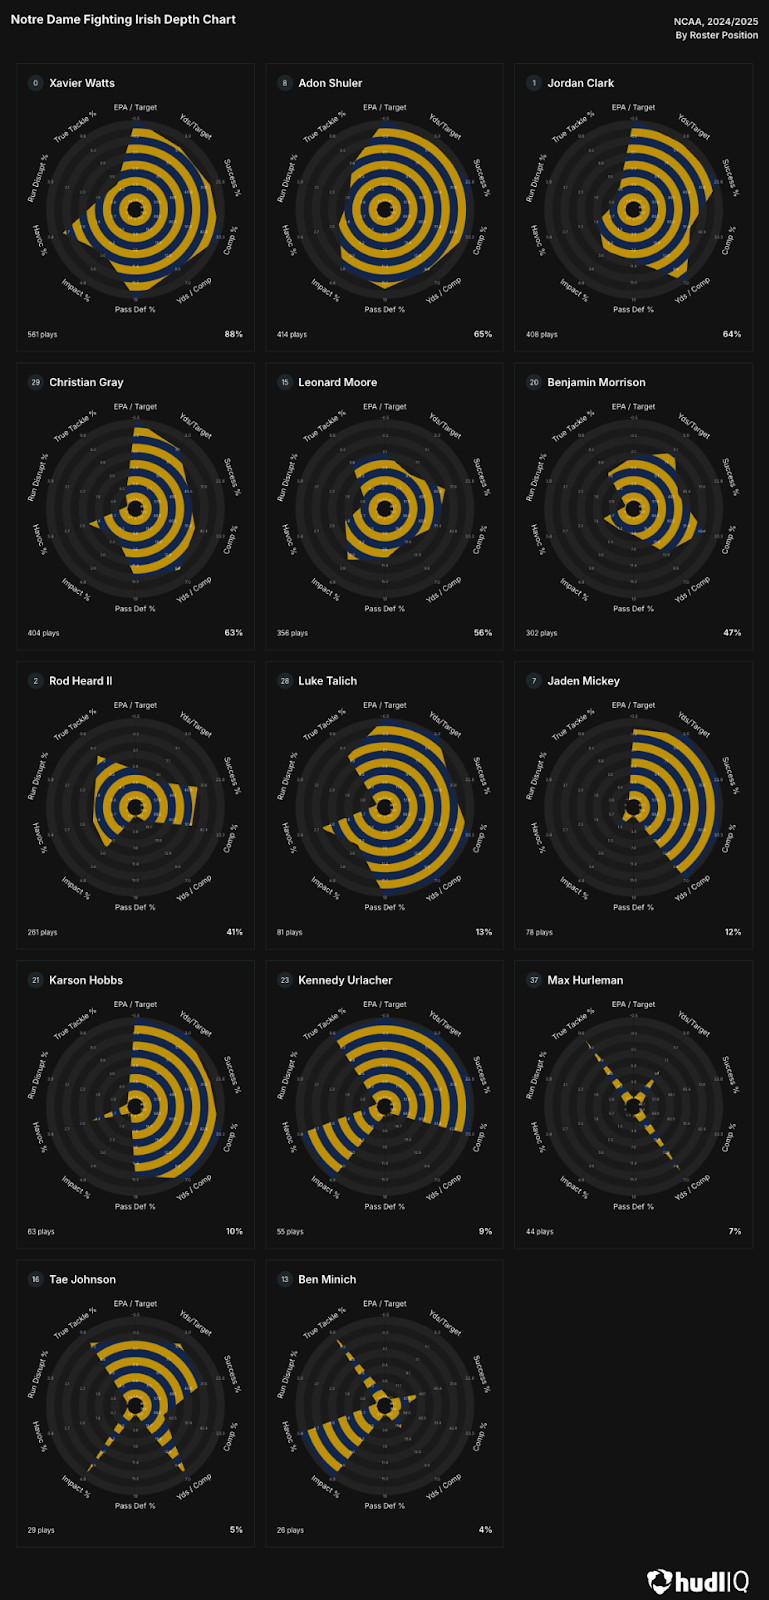
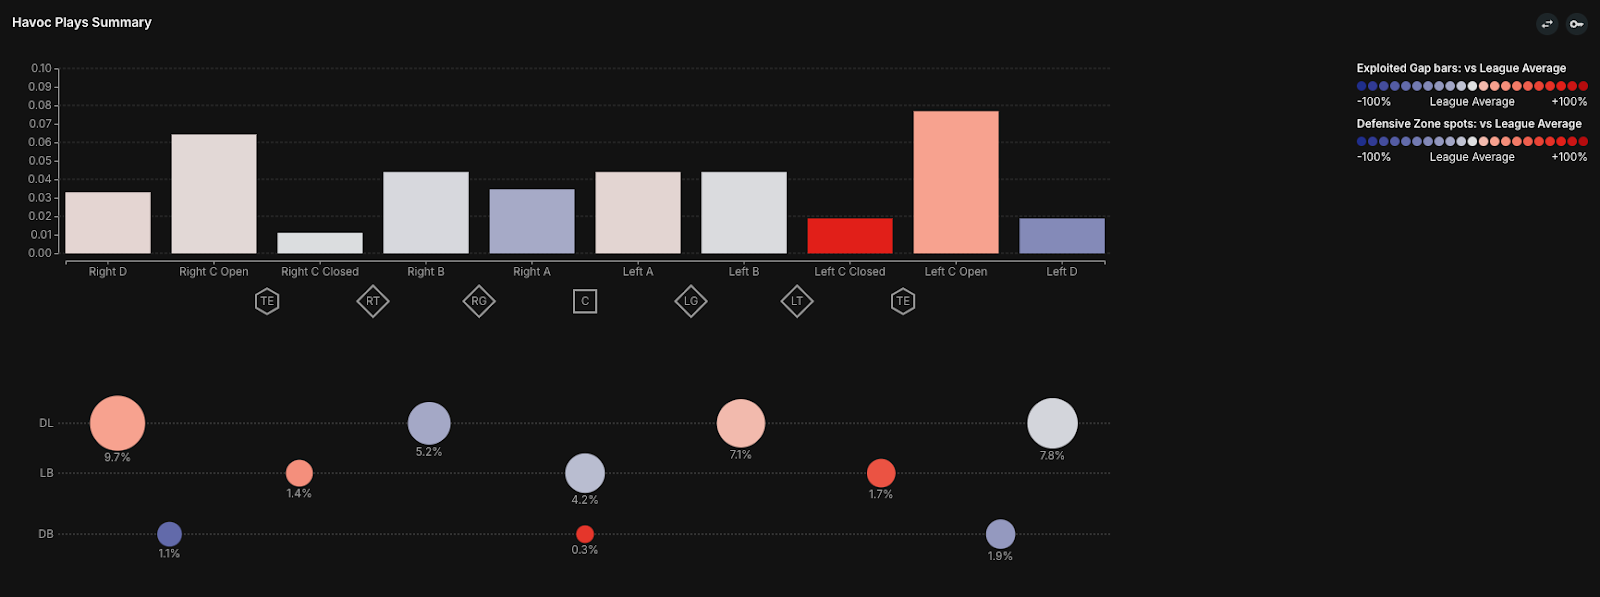
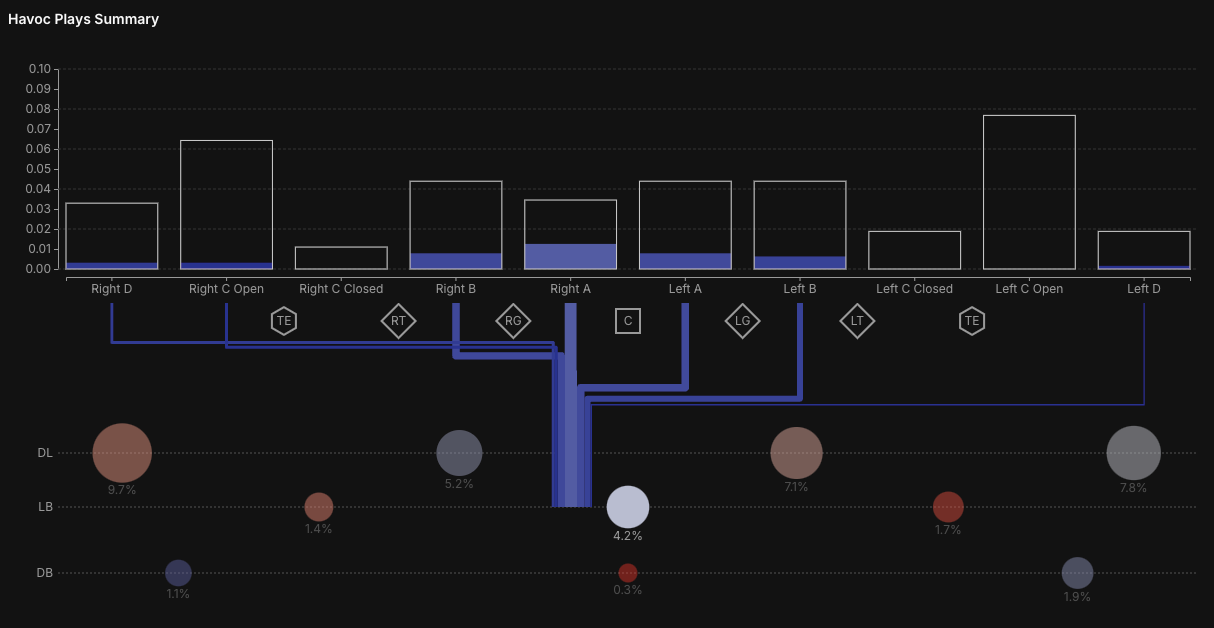
The bars and dots are color coded by comparison to league average with red being more than national average, and blue being less than national average. So in Notre Dame’s case, they are better than the national average, creating havoc in the left C gap (open and closed with a Tight End). They also create more havoc with their wide left DL, central right DL, Both Outside Linebacker sides, and central DB area.
The new chart allows users to select either a bar or dot to get more in depth information. As mentioned above, the left C gap was an area of attack for Notre Dame, with the tool, you can click in those areas, and get more information about how havoc is being created in those gaps. The majority of havoc is from the defensive lineman, especially the wide right DL. The Right Linebacker, and Defensive Back spots are also creating a few of those havoc plays.
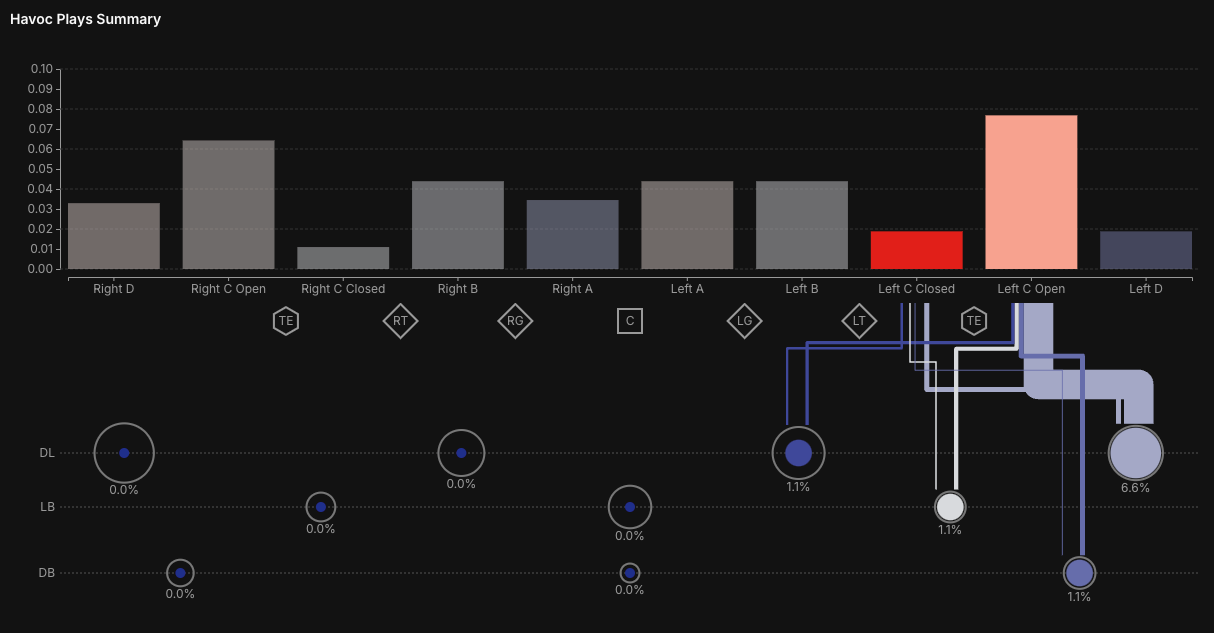
You can also click one of the dots to see which gaps players from that area typically create havoc. The middle linebacker area was the highest havoc above average area for the Fighting Irish. For players that line up in that area, you can see the majority of havoc plays are right in the gaps in front of that area. With a slight tendency to make plays to the LB left. You can also see that there are occasional havoc plays on the edges as well from that area.
One of my favorite parts of this page is still up, and shows the defender paths for the havoc that was created. Drayk Bowen is one of the players that plays in the middle of the defense for Notre Dame. We saw that the majority of havoc plays created came through those interior gaps in the offensive line. Below, you can see which havoc plays those were, and the path that Bowen took using our tracking data.
Leonardo DaVinci said, “...to develop a complete mind: Study the science of art; Study the art of science. Learn how to see. Realize that everything connects to everything else.” Even though offensive game planning is more art than science, using the “scientific principles” of using analytics to understand opposing defenses can help give coaches a better feel for their opponent, save time in the early stages of game planning, and help get to the optimal play strategy as quickly as possible.


