2023 NFL Draft: Examining The Passing Profile And Accuracy Of The Top Quarterback Prospects
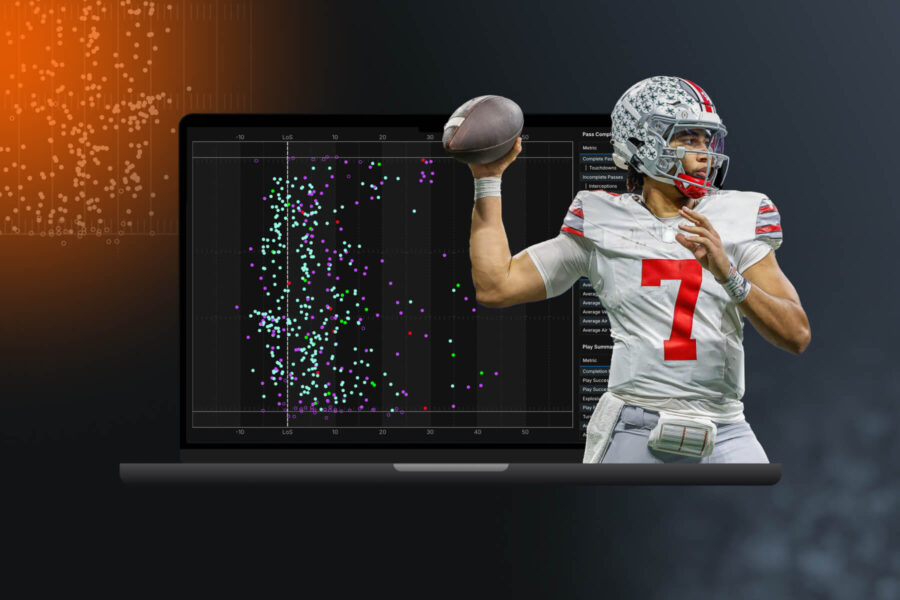
Using our expected completion percentage models, we examine the class of quarterbacks from the 2023 class– deriving analytical insights and interrogating the narratives to help understand their strengths at a deeper level.
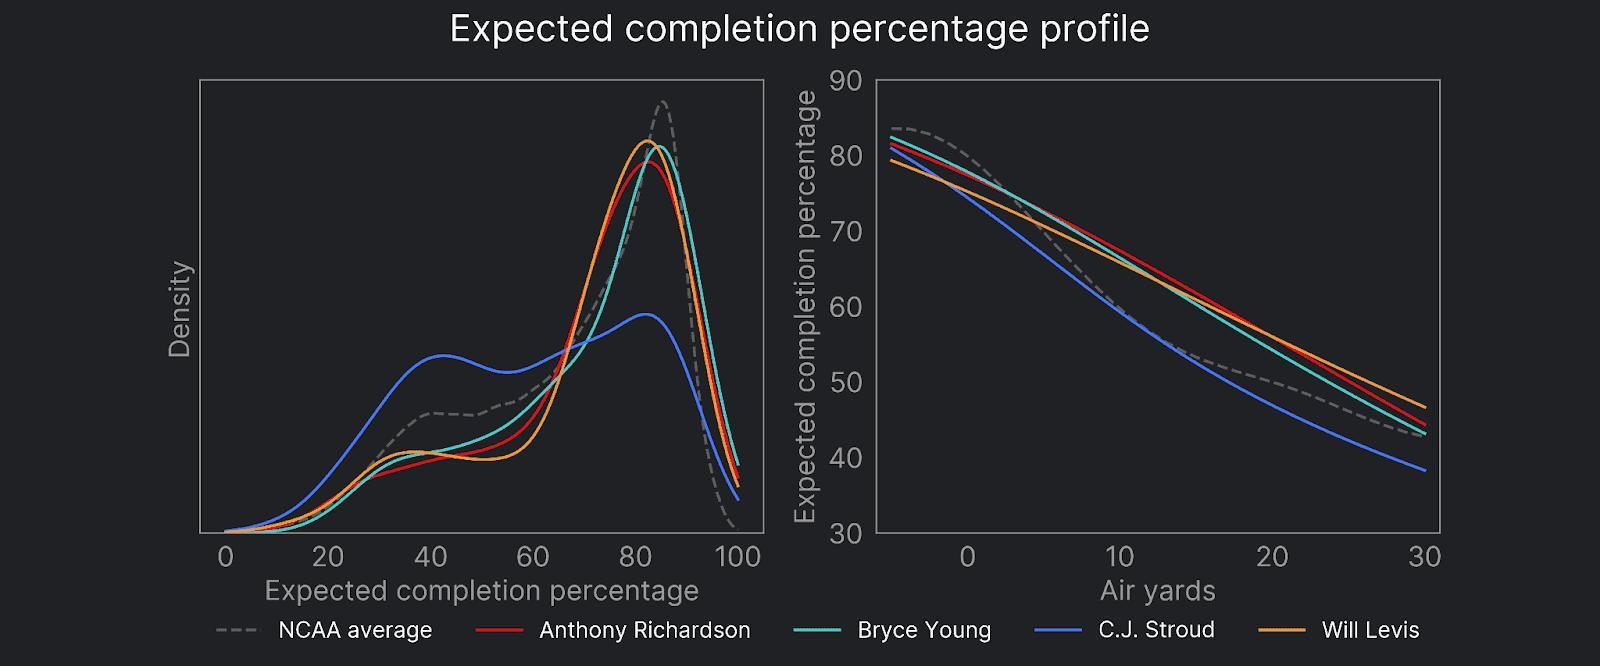
The figure above illustrates that C. J. Stroud exhibits a distinct profile compared to his peers with a clear bimodal distribution in terms of expected completion percentage. As well as the steady diet of relatively easy passes centered around 80% that his peers exhibit, he has a much larger proportion of passes at the tougher end of the distribution peaking around 40% completion rate. This most obviously manifests itself in his longer passes downfield as represented by the relationship between expectation and air yards.
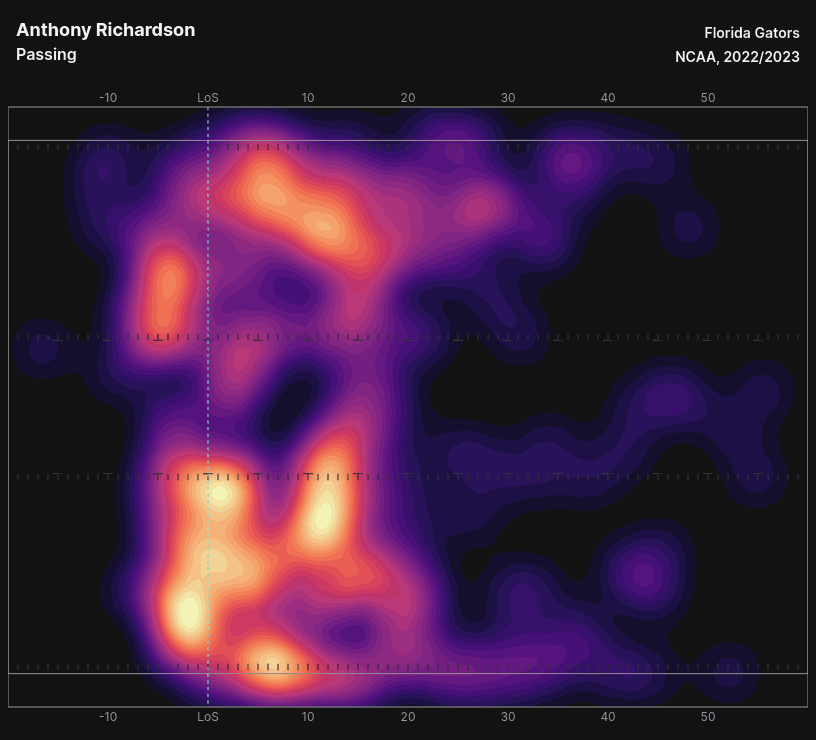
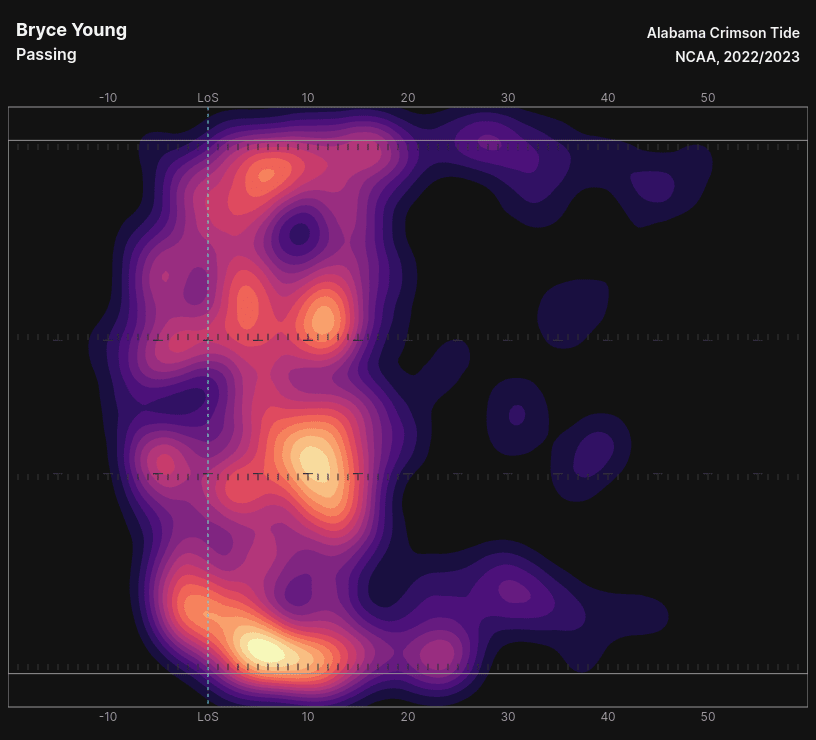
Looking at a heat map of their pass targets below, we can see Stroud with a lot of targets beyond the line of scrimmage and outside the numbers. Such passes are more difficult to complete given the longer distance between him and his targeted receiver and proximity to the sideline. Furthermore, Stroud’s receivers on average gain more than a yard less separation than his peers, which again will decrease the probability of a completion.
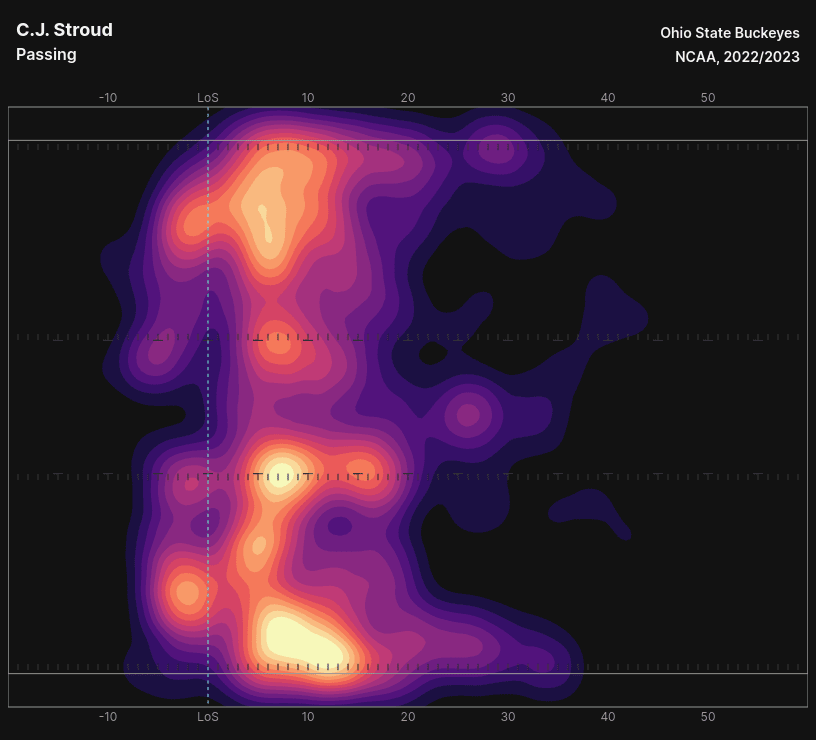
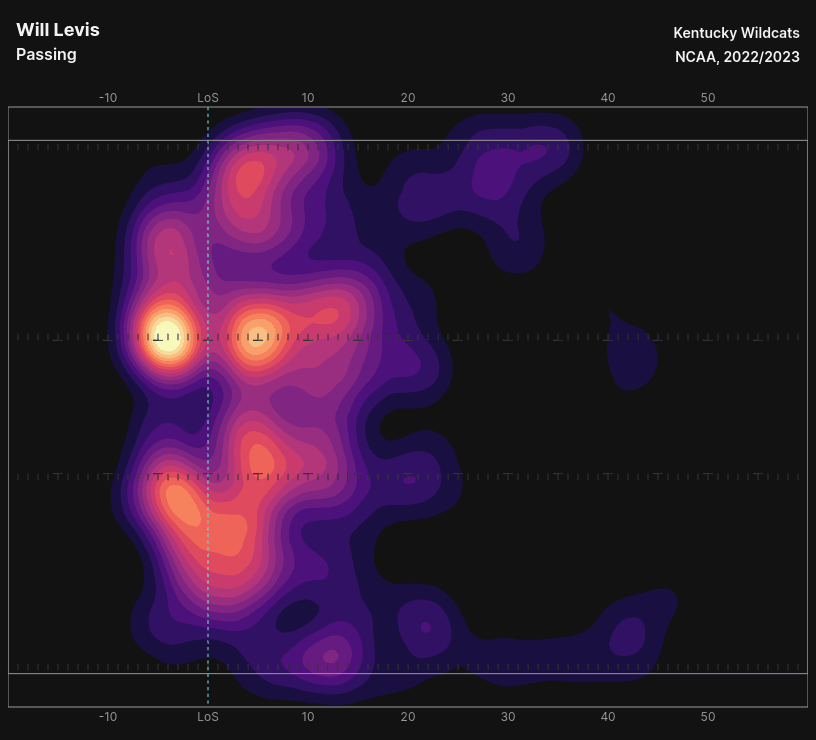
Pass Accuracy
The above illustrates a few of the insights we can find from the model expectation itself, combined with other relevant metrics such as air yards, target location and separation. Now that we’ve built a small profile of what they do and some additional context, we can move onto how well they do it through the lens of Completion Percentage Over Expectation (CPOE)*.
The figure below displays each of our QBs CPOE as a function of air yards so that we can examine how they perform not just in the aggregate but also when layering in additional context. We fit a Generalized Additive Model in order to account for both the general relationship between the two variables and the sample size driving that relationship; sample sizes are generally smaller for passes downfield, as seen by the larger uncertainty beyond approximately 20+ yards.
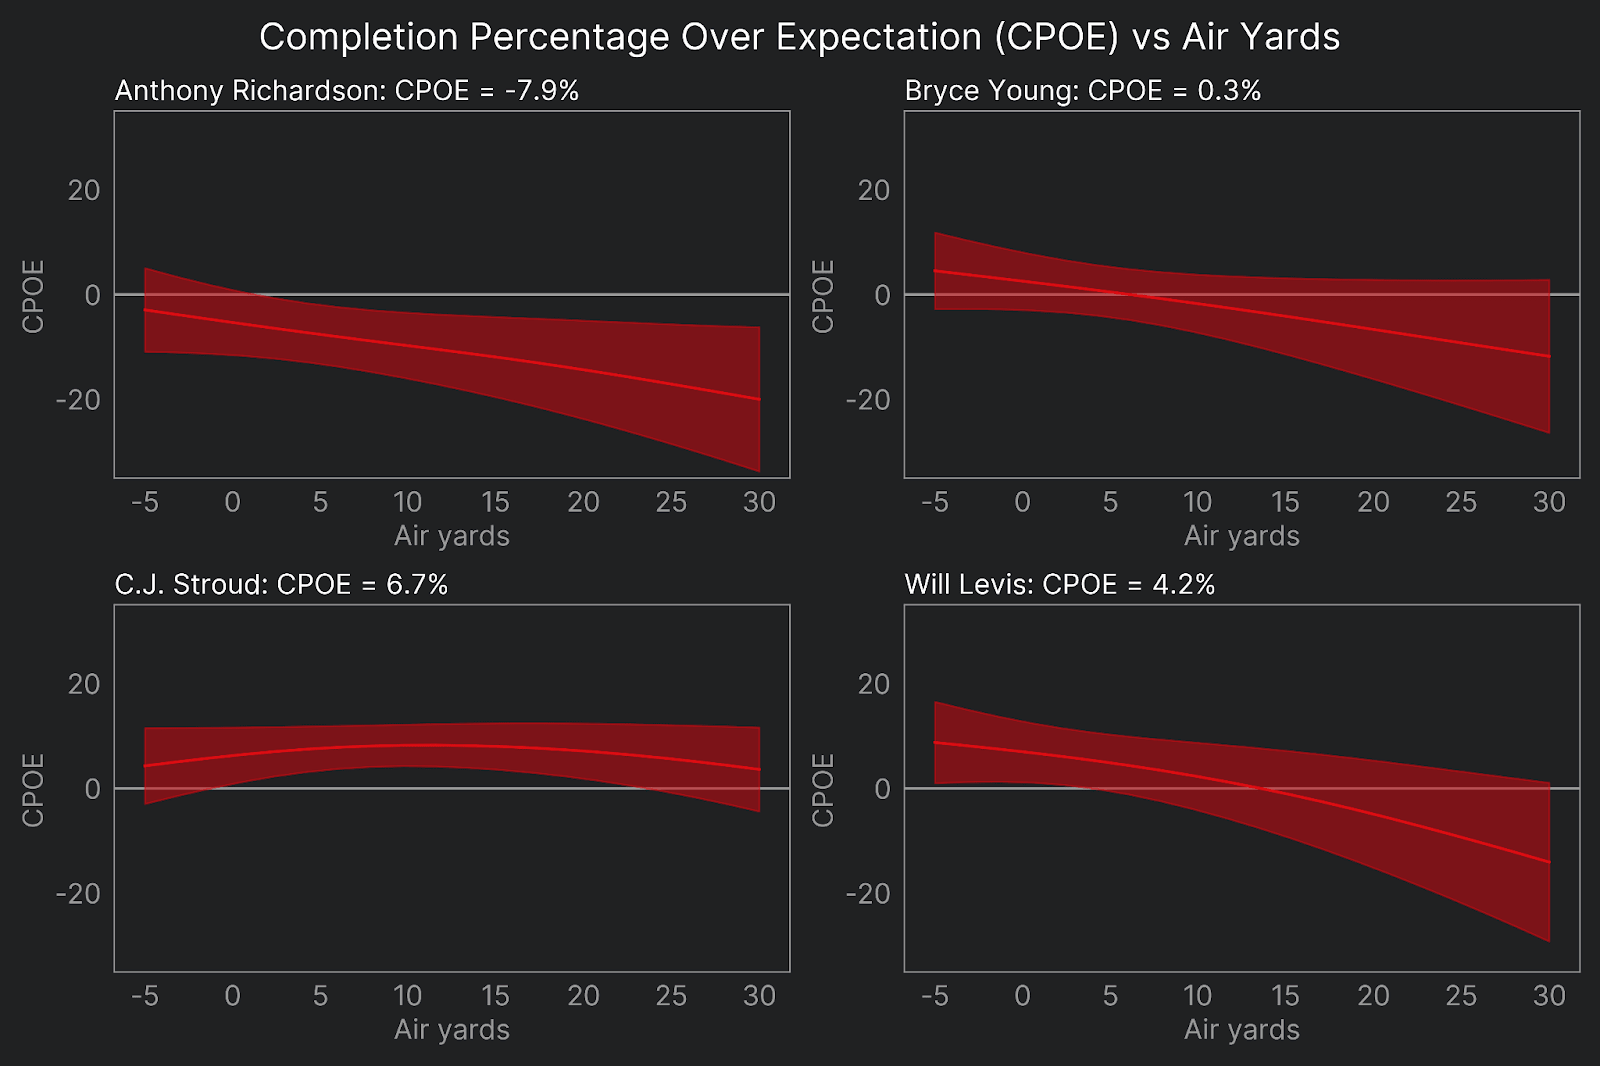
Firstly, we can observe that these QBs can arrive at different aggregate CPOE values through a variety of means. Both Stroud and Levis have strongly positive CPOE rates, but we can see that the latter mostly excels in the short game and behind the line-of-scrimmage, while the former has a much more even performance as a function of air yards.
Bryce Young is broadly around average, particularly when accounting for the uncertainty in the relationship here. He is biased towards lower performance in the 15+ yard range, but at lower volumes and hence greater uncertainty.
Much of the discussion around Anthony Robinson has revolved around the trade-off between his elite athleticism and accuracy issues (as measured by raw completion percentage). It's fair to say that adjusting for pass difficulty isn't changing that latter concern as he posts a negative CPOE both in the aggregate and beyond the line of scrimmage.
Receiver context
We can layer in some additional context to the above by examining the outputs from our compatriot model on expected catch completion - this model essentially replicates the features in the pass version, but switches out the receiver's location and separation to the time of the catch rather than the pass. We also include our continuous pass placement data, which captures the distance from the receiver both vertically and horizontally (illustrated in the figure below).
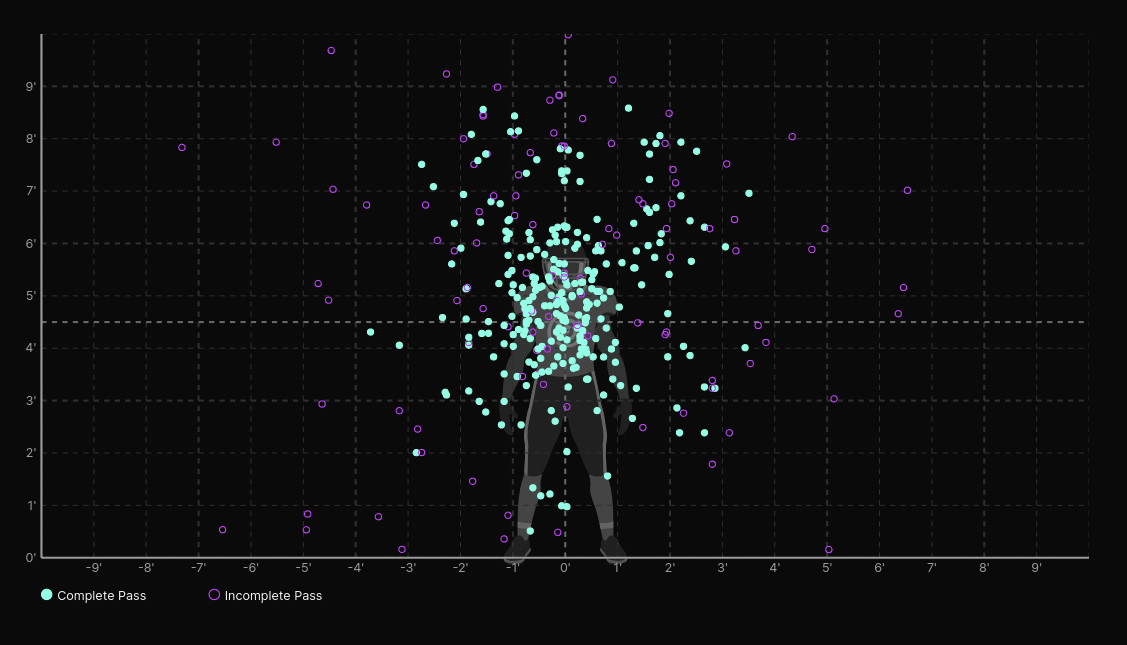
Similarly to how we calculate CPOE, we can calculate Catch Rate Over Expected (CROE) using our expected catch completion model. Stroud’s receivers led the way of these 4 QBs with a CROE of +3.09%; he had a particularly profitable relationship with his two most common targets, Marvin Harrison Jr. and Emeka Egbuka, who hit +5.96% and +5.45% respectively on over 100 targets. Levis’ receivers were around league average with a CROE of +0.35%.
Given his close to average CPOE, Bryce Young perhaps suffered the greatest impact due to his receivers failing to reign in his throws, with a CROE of -1.78%. Finally Richardson’s receivers brought up the rear with a CROE of -1.98%; Richardson was particularly hit on throws under 10 yards.
While we shouldn’t absolve the QBs role** in positive vs negative CROE outcomes and assign all of the credit/blame to receivers, acknowledging the catching skill of receivers is additional context that we can layer into an analysis.
Conclusion
Of this years’ top prospects, C.J. Stroud is the stand-out with his distinct profile and ability to accurately hit his receivers, particularly downfield relative to his peers. Anthony Richardson’s much discussed accuracy issues are still prevalent when accounting for the difficulty of his passes, albeit with some additional context around his receivers not helping his cause. The above analysis is just one lens when it comes to evaluating QBs in general and more specifically in the high stakes decision making environment of the NFL draft.
We’re just scratching the surface of the potential of the model at this point - we’ve only focused on receivers that were targeted, but we can also estimate completion probabilities for the route runners on a play who weren’t targeted. Quantifying choices not made and their potential outcomes is another prism through which to assess QBs, and this model is the first stepping stone towards such an evaluation framework.
* CPOE is calculated by subtracting the model’s expected probability from the actual outcome of a given pass e.g. if the model estimates a throw has an expected completion rate of 0.8, a successful pass would gain +20% in CPOE (1-0.8*100) while an unsuccessful outcome would penalize the QB -80% in CPOE (0-0.8*100). Averaged over a number of passes, we can glean insights regarding a QB’s accuracy - a CPOE of 0.0% would indicate a QB is completing their passes in line with their expectancy (effectively at league average rates), while positive and negative values indicate greater and lower accuracy respectively.
** Pass velocity, trajectory and hitting the receiver “in-stride” could be potential factors for example that aren’t accounted for in the model.


